Introduction
I was curious to study how does the RAT pedal works because I needed a second distortion pedal and just didn’t want to remove the one installed on my pedal-board each time. So I first had the idea to clone it, meanwhile with the original components (not those that are used nowadays), and with a negative centered DC socket, to make it compatible with my Boss power supply. However, by investigating a bit on internet, I figured out that some people proposed interesting modifications on the RAT, and I decided to try them on my protoboard. The results were satisfactory for some of them to my ears. Thus, I decided to make my version of the RAT including those modifications and I want to share the results here.
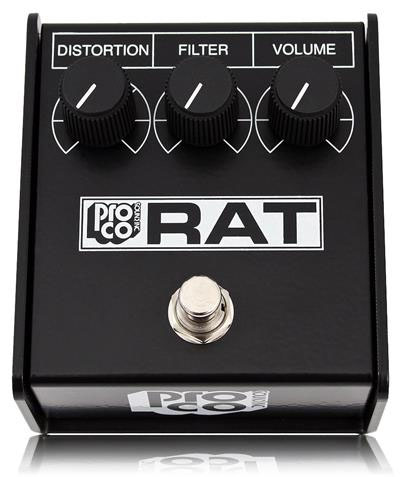
Figure 1: The ProCo RAT
The Pro Co RAT is a distortion pedal for electric guitar designed at the end of the 70’s that became very popular at the beginning of the 80’s [1]. It’s circuitry is quite simple, we can divide it in four blocks: distortion stage, tone control, output stage and power supply (see ref. 2 and figure 2). Actually, the RAT is still available, but some of the electronic components have been changed. Indeed, in the new model the operational amplifier OP07DP of Texas Instrument substitutes the original LM308 op-amp. On the other hand 1N4148 diodes substitutes the 1N914 clipping diodes [1].
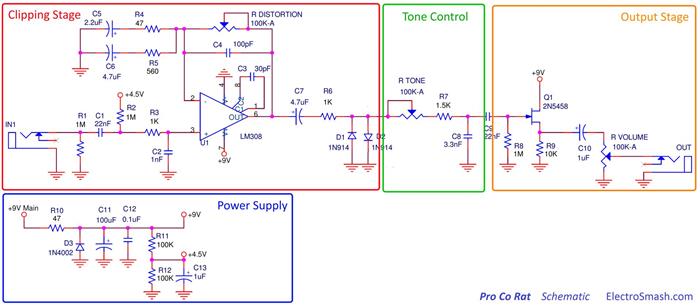 Figure 2: RAT pedal schematic (from http://www.electrosmash.com/proco-rat)
In this article, we deal with two modifications on the RAT (you can see a list of possible modifications in Ref. 1 for example). In the first one we have changed the Si (silicon) clipping diodes by Ge diodes (germanium) and red LEDs (Light Emitting Diodes). In the second one we have short-circuited one resistance connected to the operational amplifier, leading to a thicker bass response. The goal here is not to give a detailed explanation of the overall electronic circuit. For those who are interested, Ref. 2 is full of interesting information giving the schematics, the original components of the oldest model and some explanation of how does the circuit works. Here we just want to address the points that are needed to understand the modifications mentioned above. To our knowledge those points are not addressed in detail elsewhere . Finally, at the end of this writing I provide the perfboard drawing I designed to fabricate my own model.
Theory of distortion
Following ref.3: “The word distortion refers to any modification of wave form of a signal, but in music it is used to refer to nonlinear distortion (excluding filters) and particularly to the introduction of new frequencies by memoryless nonlinearities. In music the different forms of linear distortion have specific names describing them. The simplest of these is a distortion process known as “volume adjustment”, which involves distorting the amplitude of a sound wave in a proportional (or ‘linear’) way in order to increase or decrease the volume of the sound without affecting the tone quality. In the context of music, the most common source of (nonlinear) distortion is clipping in amplifier circuits and is most commonly known as overdrive. “Soft clipping” gradually flattens the peaks of a signal and de-emphasizes higher harmonics. “Hard clipping” flattens peaks abruptly, resulting in higher power in the higher harmonics. This is generally described as sounding “harsh”.”
The following graph illustrates this statement showing a 440Hz wave in black, clipped by some circuitry in red.
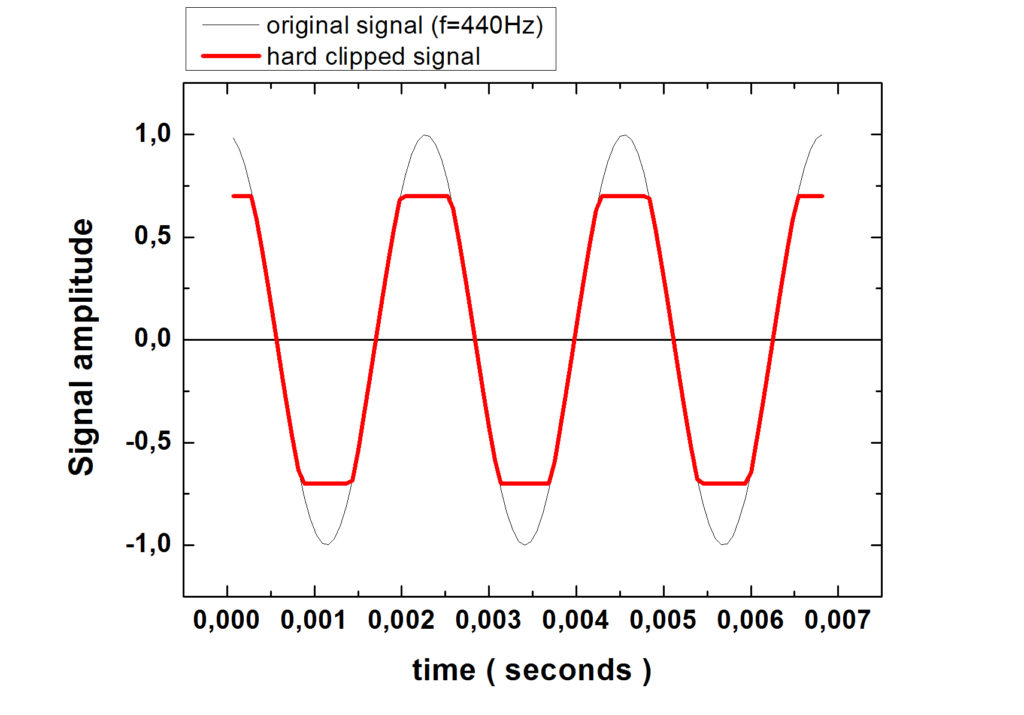 Figure 3: Sine wave (black) and clipped sine wave (red)
The clipping of a signal can be produced easily with one diode connected forward between the signal and the ground. See figure 4 for an illustration.
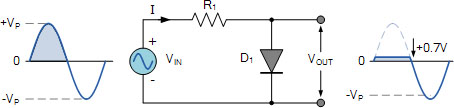
Figure 4: clipping of an electric signal with a diode (http://www.electronics-tutorials.ws/diode/diode-clipping-circuits.html)
In this configuration, to make it simple, a diode is a switch that is open, that is to say it doesn’t allow the current to flow when the voltage at its leads is less than 0.7V (for silicon based diodes). If the voltage of the signal exceeds 0.7V, the diode acts like a closed switch and the current will go to ground. As a consequence, when the signal is less than 0.7V, the signal voltage is not modified, but when it exceed 0.7V, it is flattened to 0.7V. With one diode we will have an asymmetrical clipping, whereas with two identical diodes mounted in inverse parallel, we will have a symmetrical clipped output as shown by the red curve in graph 3.
Note that another way to achieve extreme hard clipping is with the use of transistors. In this case the distortion of the audio signal is so heavy that we are used to call it a fuzz effect. This is what are using the famous Fuzz Face, the Fuzz factory and many other effect pedals (actually based on the Fuzz Face circuit). You can look at ref.5 for an interesting review and many examples of fuzz pedals.
Changing the clipping diodes of the RAT
In the figure 5 we show the schematic of the pedal where both modifications treated in this article have been circled in red. We first deal with the clipping diodes substitution.

Figure 5: schematic used for the fabrication of the modified RAT
As said before, when the signal is larger than the threshold voltage of the diode (typically 0.7V for Si diodes), the signal gets flattened. This leads to an enhancements of the produced harmonics and to a distortion of the sound. If we choose a diode with a different threshold voltage, the amount of distorted signal will vary. For example, if we take a red LED (Light Emitting Diode), whose threshold voltage is around 1.9V, the flattening effect of the signal will occur only when the signal is above 1.9V. This means that we should expect a less distorted signal. Maybe more like an overdrive. An other thing to expect is that the intensity of the signal should be larger than with a Si diode. Indeed, in figure 3, we can see that when the signal is flattened, the signal amplitude is reduced. On the contrary, if we take now a diode with a smaller threshold voltage, like a Ge (Germanium) one, whose threshold voltage is about 0.3V, we should expect more flattening of the signal thus a more distorted and compressed signal, and a lower intensity.
The following video illustrates the effect of changing the clipping diode material on the sound (no additional treatments on the sound have been added like reverb, compression, equalization, etc…):
Filtering modification of the RAT pedal
We want here to understand how does R5, R7, R8, C6, C10 and C11 actuates on the audio spectrum of the circuitry. Instead of finding a literal expression of the gain versus frequency evolution, we try to get an intuitive understanding of what is happening here.
Simple description of the behaviour of a capacitor
What we have to know is that a capacitor is a component that behaves differently in function of the frequency of the signal that arrives to its terminal. Without going to much in details, a capacitor is an insulator (material that doesn’t let the current flow through it) embedded between two metallic films. When one applies a constant voltage to a capacitor, as it won’t let the electrical current passing through it, the electrons of the electric current generated by the battery will accumulate on one side of the insulator. The other side will be depleted of electrons (or we can say it is accumulating holes). So, the capacitor is getting charged electrically. The time it needs to be charged will depends on the value of the capacitance C of the capacitor and of the resistance R that we choose to put with it. Typically this time is given by the product R x C (in seconds). If our signal doesn’t vary with time, or very slowly compared to the RxC product, the capacitor stays charged and thus “blocks” the signal variation. It filters that kind of “slow signal”. However, if the signal varies very fast, so fast that it doesn’t give the time to the capacitor to get charged, this signal will “not see” the capacitor and the information will pass through it. So, the fast variations are not filtered by it.
To resume, we can “say” that a capacitor acts like a switch that is opened for low frequencies and closed for high frequencies.
The definition of what we consider low and high frequencies depends on the value of R and C. As said above, the characteristic time of charging of the capacitor is given by R x C. We can define a cutting frequency f0, such that a capacitor will let pass the frequencies that above f0. It can be found easily that f0=1/2πRC. If RC is large, 1/2πRC is small, thus f0 is small. On the contrary if RC is small, 1/2πRC is large and f0 is large.
An audio signal can be seen as a sum of sine waves that have different frequencies and amplitudes (see Fourrier transformation for more details). The association of a resistance and a capacitor will create a filter, “blocking” the frequencies that are on one side of f0 and “transparent” to the frequencies that are on the other side. By choosing the right values of R and C, we have a control on which frequencies we want to filter.
Filtering part of the RAT
Let’s come back to the circuitry of the RAT pedal, and focus on the filtering part of it. It is represented in figure 6.
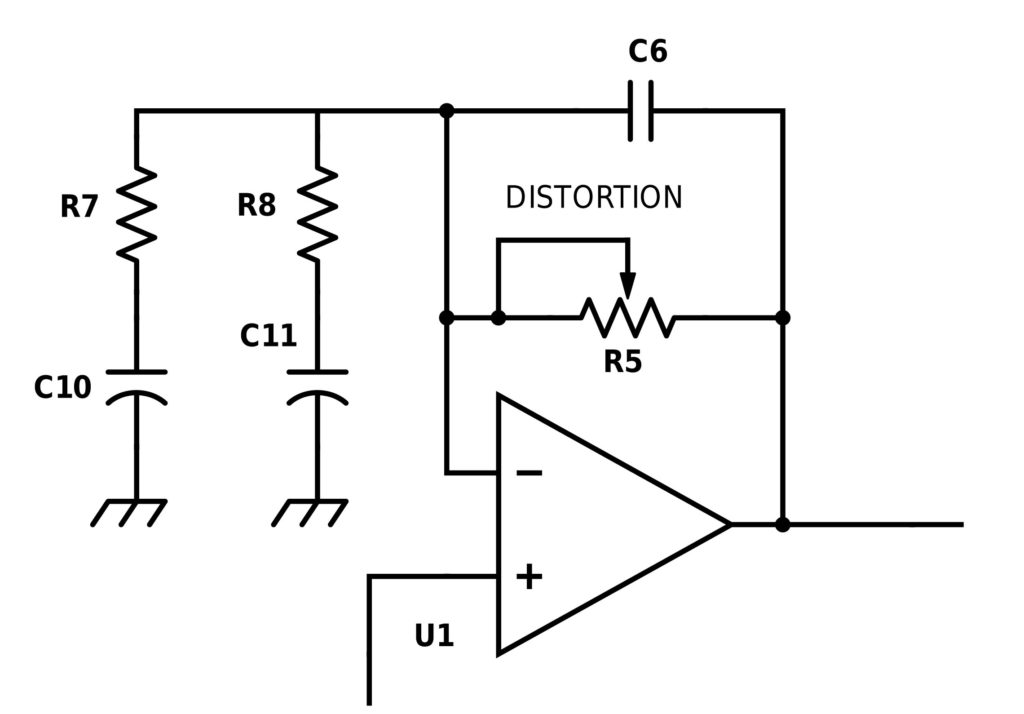 Figure 6: the operational amplifier environment
As we have commented before, we can model the behaviour of a capacitor as an open switch for the frequencies of the signal smaller than the 1/2πRC quantity, and a closed switch for the larger frequencies. Let’s apply this model to the circuit of figure 6, composed by three R-C couples: R7-C10, R8-C11 and R5-C6. We have R7=560 ohms, R8=47 ohms, R5 is a 100kohms potentiometer, C10=4.7 µF, C11=2.2 µF and C6=100 pF.
We can calculate their associated cutoff frequency by calculating the quantity 1/(2πRC).
- For R7-C10, we find f1=1/(2p × 560 × 4.7e-6)=60 Hz
- For R8-C11, we find f2=1/(2p × 47 × 2.2e-6)=1539Hz
- For R5-C6, we find f3/(10e3 × 100e-12)=159kHz where we have arbitrary choose 10 kHz for R5.
We note that f1<f2<f3.
Then, we will consider 4 cases, depending on f with respect to f1, f2 and f3. Before going further, we want to come back briefly to the basics of OA (operational amplifiers). Having this in mind, the following will be more straight.
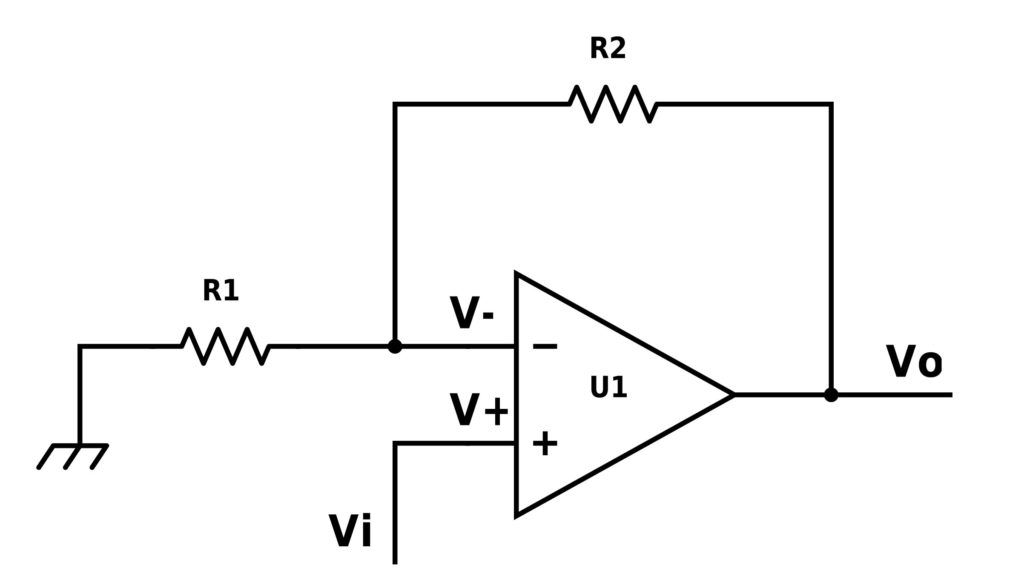 Figure 7: typical inverting amplifier problem
In the figure 7 we have represented the case of an inverting amplifier. This configuration is called inverting because the resistance R2 connects the output of the OA to the negative input. We can apply the Millman formula to find that:
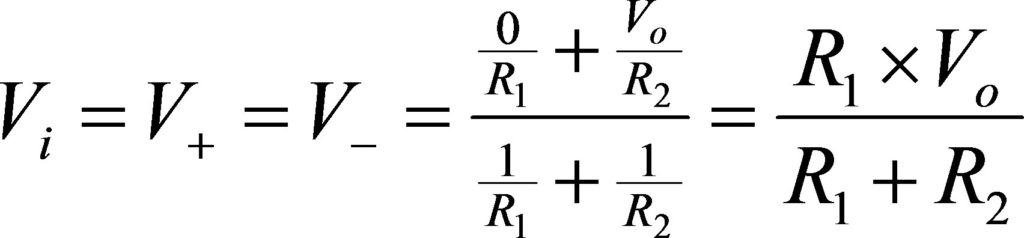
Thus we find that the relation between the output voltage Vo and the input voltage Vi is:
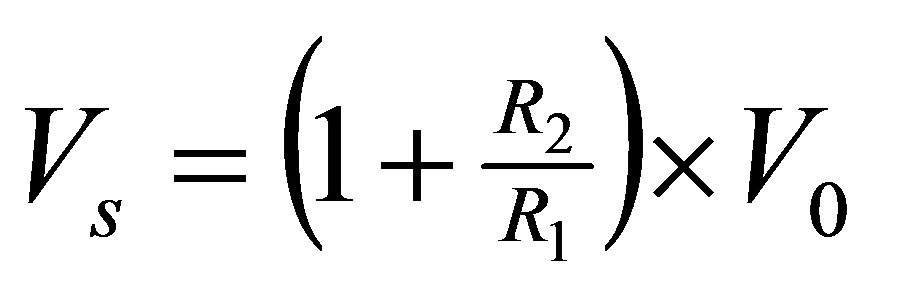
(1)
Let’s now come back to our problem:
- If f<f1, we are in the case where all the capacitors are equivalent to an open switch (see figure 8).
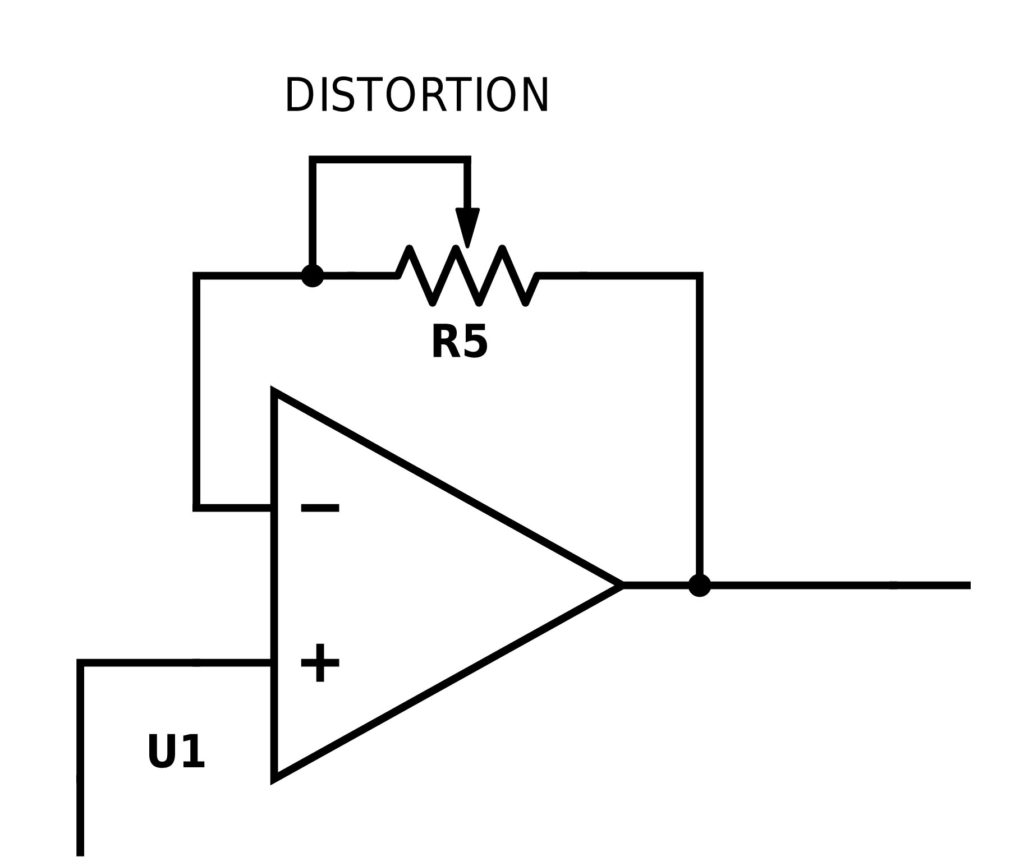 Figure 8: case f<<f1
We can use (1) by substituting R2 by R5 and R1 by a resistance with an infinite value. In the equation (1), if R1 is very large compared to R2, R2/R1 is very small, tending to 0. Thus, we find that Vs=Vo. So at very low frequencies, the gain G, which is given by V0/V1 is G=1.
2. If f1<f<f2, we are in the case where the capacitors C11 and C6 are equivalent to an open switch and C10 is like a closed switch (that is to say a conductive wire, see figure 9).
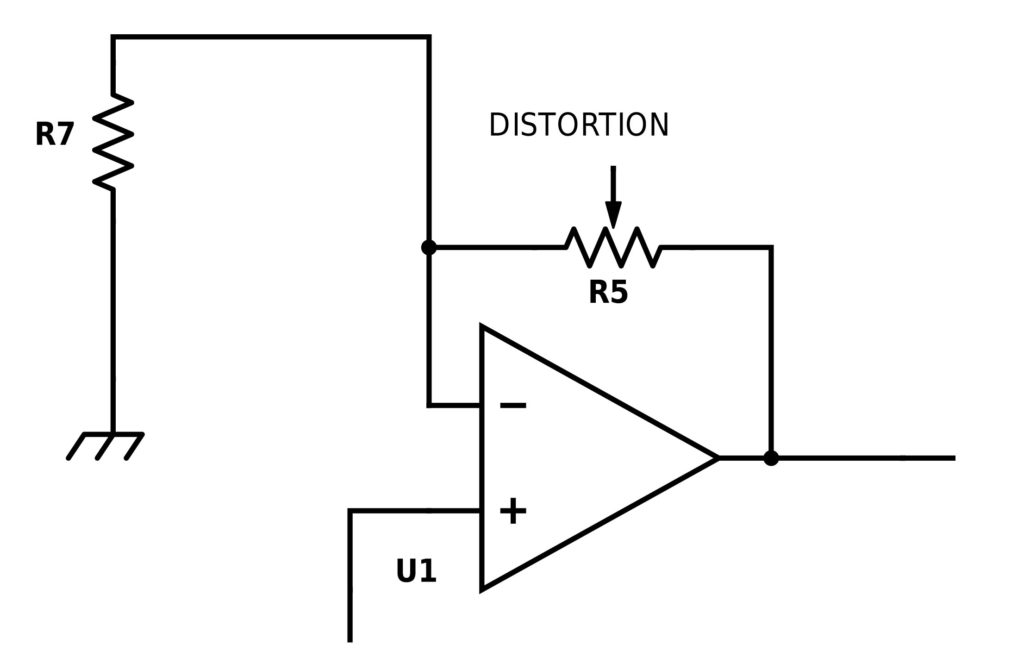 Figure 9: case f1<f<f2
In this case we substitute R1 and R2 in (1) respectively by R7 and R5.
Thus we find that Vo=(1+R5/R7)xVi. So the gain G=1+R5/R7=1+10k/560=19
3. If f2<f<f3, we are in the case where the capacitor C6 is equivalent to an open switch and C10 and C11 are like a closed switch (see figure 10).
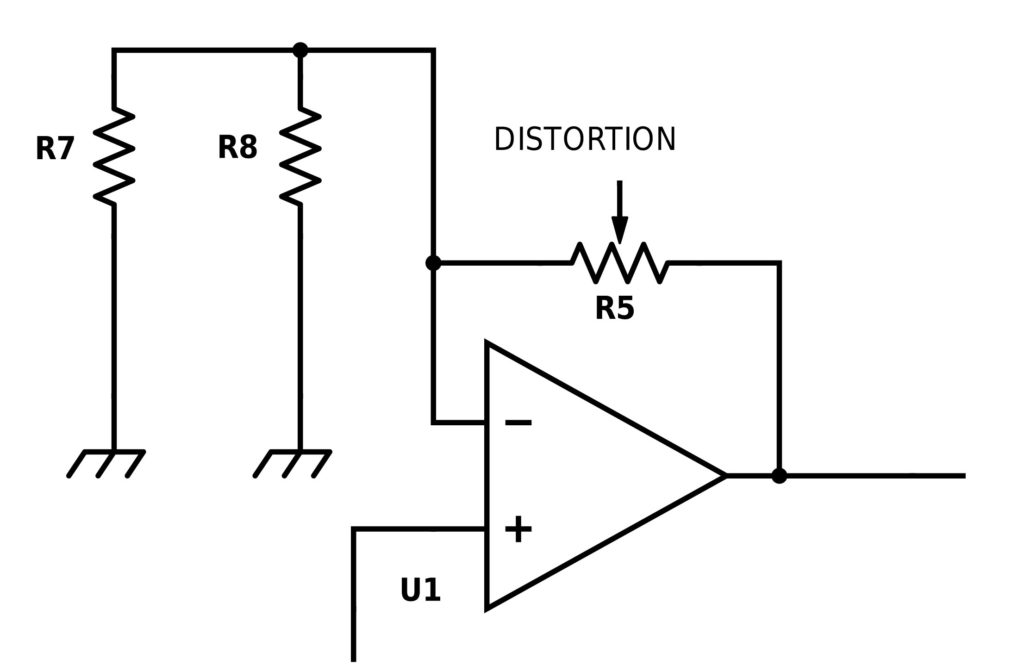 Figure 10: case f2<f<f3
In this case we substitute R1 and R2 of (1) respectively by R7//R8 (// is an abbreviation standing for R7 and R8 in parallel) and R5, with R7//R8=R7xR8/(R7+R8)=560×47/(560+47)=43 ohms.
Thus we find that Vo=(1+R5 / (R7//R8))xVi. So the gain G=1+R5 / (R7//R8)=234.
4. If f3<<f, we are in the case where all capacitors are equivalent to a closed switch or a conductive lead (see figure 11).
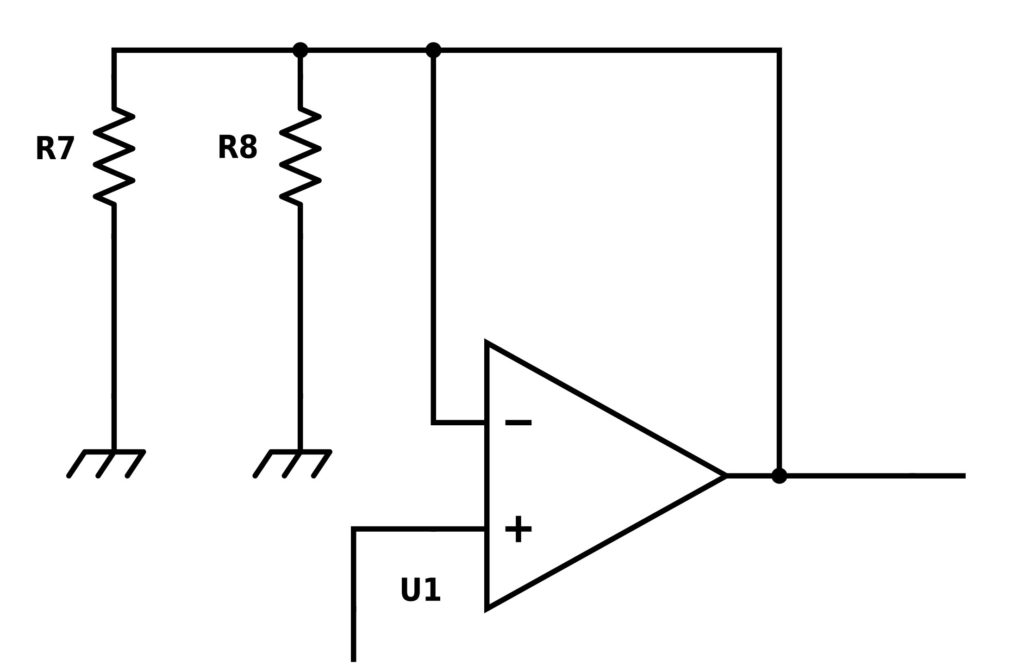 Figure 11: case f3<<f
In this case we substitute R1 and R2 of (1) respectively by R7//R8 and a 0 ohm resistance. So it is easy to demonstrate that we come back to the case Vo=Vi and thus G=1.
Simulation of the filtering circuitry
We have performed the simulation with PSPICE on this portion of the schematic:

Figure 12: schematic used for the PSPICE simulation.
The signal is modeled by the sine wave generator of amplitude 1V. We sweep its frequency from 0.01 Hz to 108Hz (yes, well above the ear response), and we measure how does the output voltage varies with frequency.
The following graph shows the results of the simulation, showing the variation of the gain with the frequency of the signal:
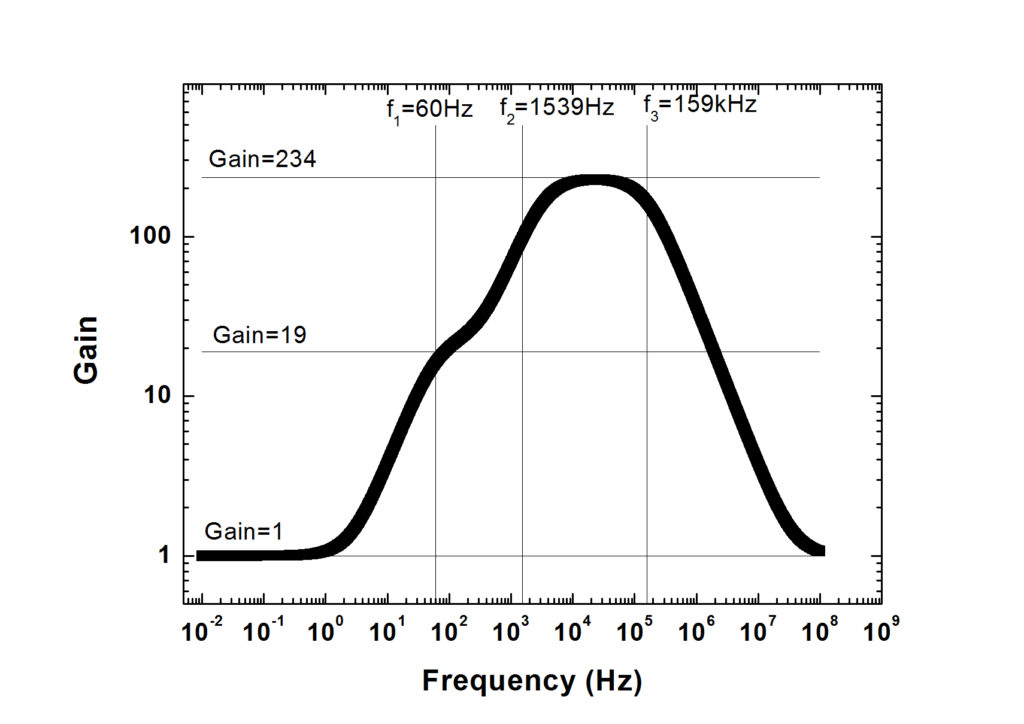
Figure 13: results of the PSPICE simulation on the gain evolution vs frequency
The black symbols represent the results of the PSPICE simulation. To compare with the simple model we have developed above, we have also drawn the 3 values of gain (G=1, 19 or 234) and the 3 cutoff frequency (f1=60, f2=1539 and f3=159kHz).
We can check that the simulation agrees well with our academic model: well under 60Hz and well above 159kHz we find a unity gain. Between 60Hz and 1539Hz we have a first step of gain in agreement with our result around 19, and we reach a maximum around 234 between 1539Hz and 159kHz.
We now represent the simulation for different values of resistance of the distortion potentiometer, within the ear response (20Hz-20000Hz):
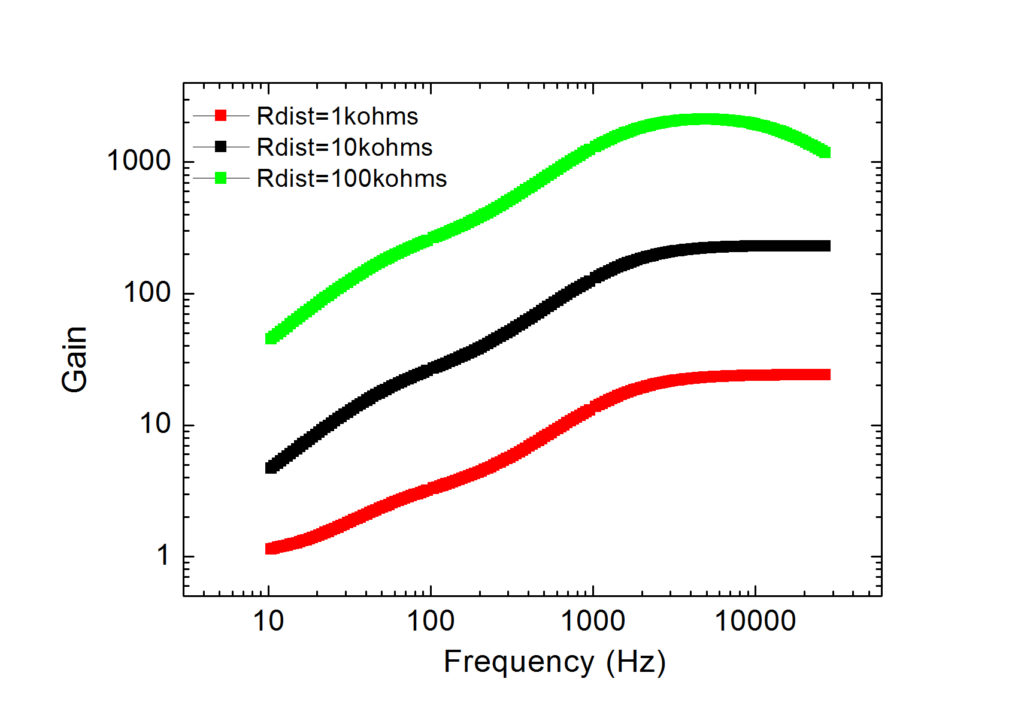 Figure 14: Results on the PSPICE simulation on gain evolution vs frequency for different values of the distortion potentiometer
We see an increase of the overall gain with the resistance of the distortion potentiometer, with always a larger gain for high frequencies.
Knowing this, what is interesting us now is to change the gain spectra. With our understanding on the influence of the resistances and capacitors on the gain shape, we have performed a PSPICE simulation by opening the resistance R7 (560 ohms) or the resistance R8 (47 ohms). The following figures shows the results we have found:
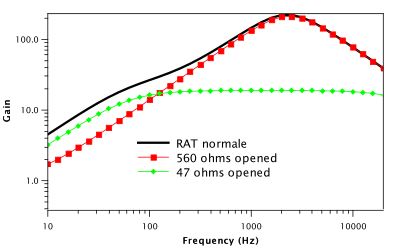
Figure 15: Results on the PSPICE simulation on gain vs frequency with R7 or R8 opened compared to the default case.
The simulations shows that opening R7 (560 ohms) has not a big influence on the gain spectra. However, by opening R8 (47 ohms) there is a clear change: the spectra is flatter. The high frequencies are not so much amplified, which should lead in theory to a much bass-rich sound, or muddy sound, with a lower overall intensity. We have made the following video to check this:
Construction of the pedal
Finally we show the pedal from the inside. We have used original components.
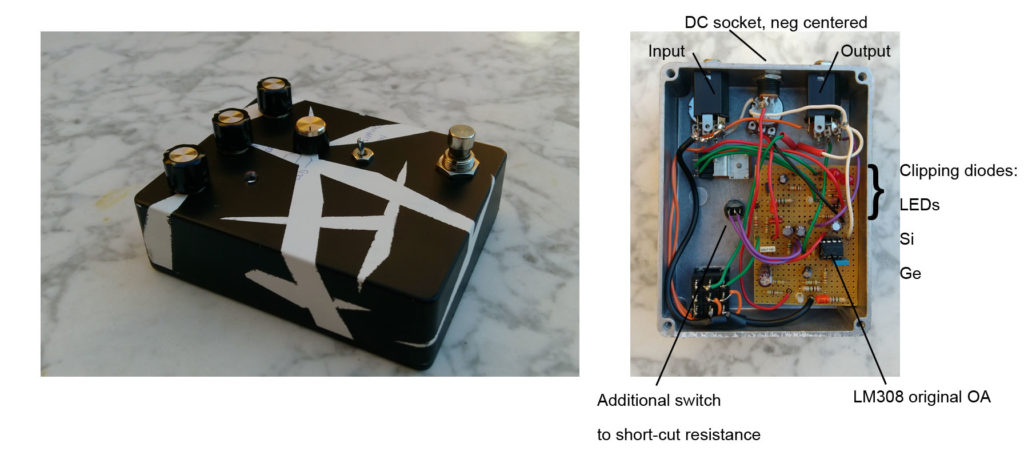
Figure 16: the modified RAT from the exterior and interior.
An easy way to fabricate your pedal without using chemicals product is to use a perfboard. The following figure shows the one I have designed (I tried to put the components as close as possible to economize space). On the left hand side is given the top side of the perfboard. On the right hand side we can see the bottom side. This view is useful, because once the components are soldered, they have to be connected through tin rails. The bottom view gives a direct view of how those rails have to be made.
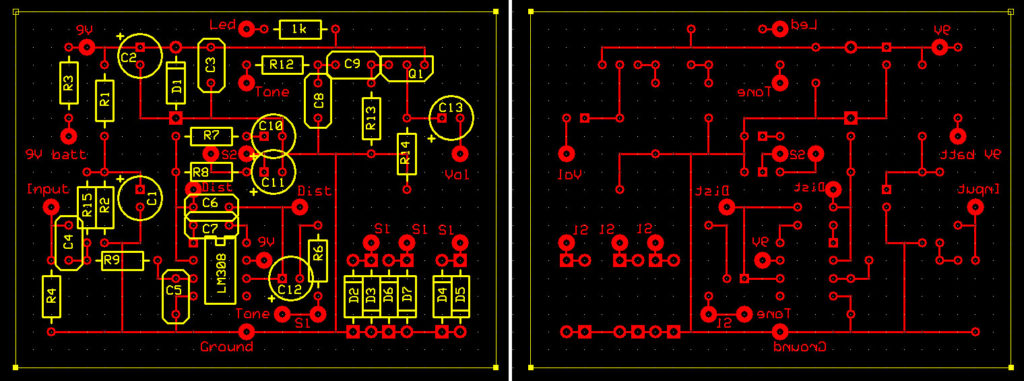
Figure 17: top side and bottom side of the perfboard. “Input” connects to the 3PDT switch, “9V batt” to the 9V battery or to the ground of the DC socket (that we want negative centered). “Led” connects to LED anode (+), “ground” connects to chassis. “9V” points have to be connected together with a wire. “Tone”, Dist”, “Vol” connect to each of the three potentiometers. S1 connects to the three ways rotary switch. S2 connects to a regular switch.
The main foot switch to switch the effect on is a 3PDT to allow true bypass, the wiring is explained in an other post (see here).
References
[1] https://en.wikipedia.org/wiki/Pro_Co_RAT
[2] http://www.electrosmash.com/proco-rat
[3] https://en.wikipedia.org/wiki/Distortion_(music)
[4] http://www.electronics-tutorials.ws/diode/diode-clipping-circuits.html
many thanks for putting this up for us to learn from
cheers !
Hi Robert, thank you for your comment.
I am adding videos on my youtube channel, if you want to suscribe you should be notificated when there is a new one.
Best regards!
Ping : Modifications de la RAT #2 : la RAT de Ruetz - Fais-tes-effets-guitare.com
Hi ! Thanks for this explanation!
Do you see any reason why it would change the characteristics to use larger resistors and smaller caps ? (Keeping RC the same). The reasons I’m asking are avoiding imprecise/crappy electrolytics but also..
I’ve been wondering what’s the power drain of that circuit is. I assume the worst case (pot at 0, large input signal, so maybe a few volts on the output of the op amp, and on the feedback).
With those tiny resistors, unless I miss something, at higher frequencies we can drain a couple hundred mAs, so almost a watt with a 5V signal…
Or am I missing something here ?
This is the best explanation I´ve read about the way the op amp works in the RAT circuit. Better than electrosmash in my opinon. Now I think I can understand better another fx circuits,
You could explain the way how it works the « soft clipping » diodes included in overdrives la TS808, the way taken for the signal once it reach the op amp.
Thank you
Thanks for this – I have a modded RAT (BYOC Mouse clone). They put a linear 1K pot in place of the 47 ohm R4 resistor. I was trying to understand what it does, and this helped me figure it out. I prefer the mid peak to the flat response 🙂
Great, thank you for your comment! 🙂